Querying Measurement Data
Probably one of the most important features of the API is the ability to query measurement data. In this document, we refer to measurement data as time series data that was either directly measured by devices of a plant (site) or that is calculated based on the directly measured data. Metrics that are tracked include:
- AC Active Power
- AC Voltage
- Availability
- DC Power
- DC Voltage
- Irradiance
- Performance Ratio
- Temperature
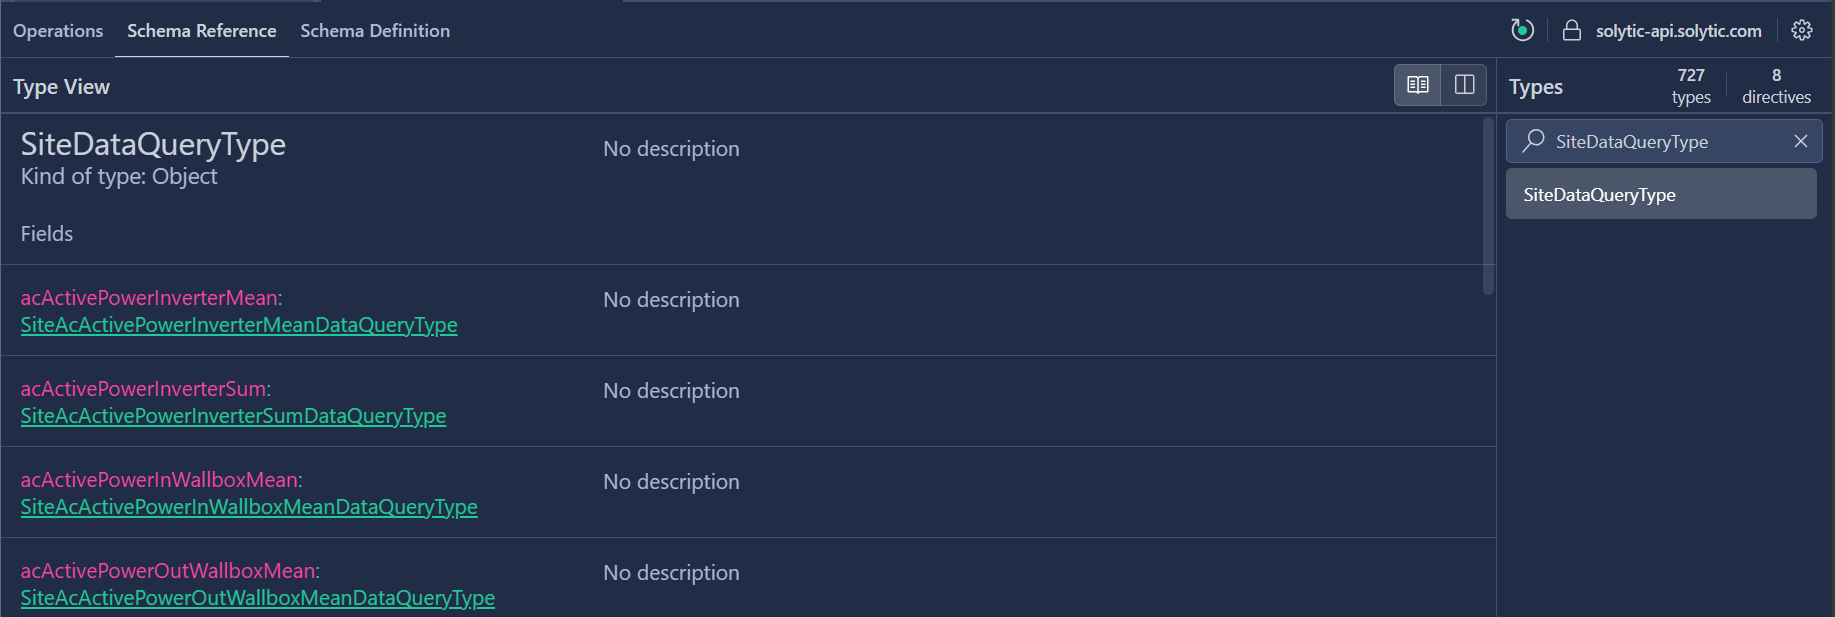
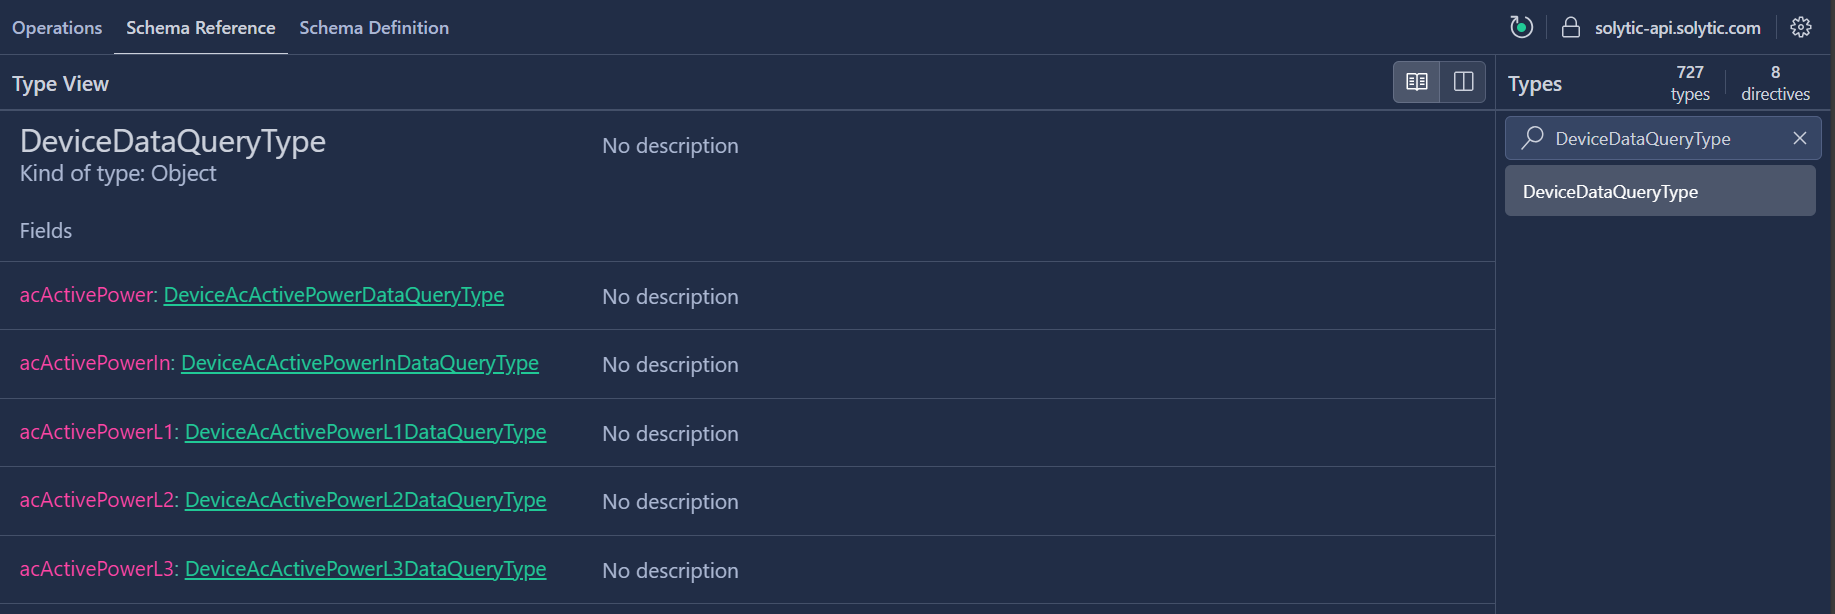
To access the comprehensive list of measurements, please consult the GraphQL schema. You can explore the queries, mutations, and types using the Playground tool. Access the Schema Reference tab and then use the search for SiteDataQueryType or DeviceDataQueryType. Please refer to Using Playground documentation for guidance on navigation.
SiteDataQueryType
 DeviceDataQueryType
Not all metrics are available for each site/device. The available metrics depend on the physical configuration of the plant, the hardware manufacturer, and whether Solytic supports the metric.
Example Query
As a quick start, here is an example:
query EXAMPLE_QUERY($eid: String!, $start: Date!, $end: Date!) {
  device(input: { eid: $eid }) {
    device {
      eid
      data {
        acActivePower {
          raw(
            input: {
              timeRangeSelector: { from: $start, to: $end }
              includeNulls: true
            }
          ) {
            dataPoints {
              timestamp
              value
            }
          }
        }
      }
    }
  }
}
The query is executed with these variables:
{
  "eid": "<deviceEid>",
  "start": "2022-05-17",
  "end": "2022-05-17"
}
We get the following response (shortened to show only two data points):
{
  "data": {
    "device": {
      "device": {
        "eid": "<deviceEid>",
        "data": {
          "acActivePower": {
            "raw": {
              "dataPoints": [
                {
                  "timestamp": "2022-05-17T00:00:00.000",
                  "value": 0.5
                },
                {
                  "timestamp": "2022-05-17T00:05:01.000",
                  "value": 2.61
                }
              ]
            }
          }
        }
      }
    }
  }
}
Explanation:
- We are fetching a device by its
eid - We then use the
datafield to query any related device data- In this case, we fetch all raw "AC active power" values from May 17th 2022
- We also want to fetch values that are stored as null
- The response will give us an array of data points with a timestamp and related value
Concepts
Measurement data includes metrics such as the AC Active Power, the DC Power, and others.
Currently, we are offering data queries on device and site level
(refer to Basic Concepts: Entities for more details).
Furthermore, depending on the metric, we offer various granularities (intervals) in which the data can be queried (the name on the left is the same as in the GraphQL schema):
raw: raw data as transmitted by the deviceminute: 1 minutetenMinutes: 10 minutesfifteenMinutes: 15 minutesthirtyMinutes: 30 minuteshourly: hourlydaily: dailyweekly: weekly (with the week starting on Monday)monthly: monthlyquarterly: quarterly (3 months periods)yearly: yearly
Not all metrics are offered in all granularities. For instance, the AC Yield is only available in hourly, daily, weekly, monthly, quarterly, and yearly intervals.
Data Query Schema
Data queries can be issued inside the device and site objects by accessing the data field.
The data queries inside the data field follow a simple hierarchical structure that allows users
to select metrics, granularities, time ranges, and the response format in a single query.
data {
  <metric> {
    <granularity>(input: { from: <from date>, to: <to date> }) {
      dataPoints {
        timestamp
        value
        count
      }
      timestamps
      values
      counts
    }
  }
}
data: this is the entry point for all data queries<metric>: this is the name of the metric that you want to query, such asacActivePower,dcPower, oracYield. Note: inspect the schema to find all metrics that we offer<granularity>: here you can select the granularity (interval) of the data, e.g.raworhourly. Note: inspect the schema to find all granularities that we offer, since not all granularities are offered for all metricsinput: this is an input object that contains the time range that you want to request. For instance, a possible input could beinput: { from: "2022-01-01", to: "2022-12-31" }to request data for an entire yeardataPoints: this object returns a list of three fields:timestamp,value,count. This format is also called wide datatimestamps,values,counts: the combination of those three list fields is the second option to query data. This format is also called long data
Example 1: query hourly AC yield values for 7 days in 2022 in the wide data format
data {
  acYield {
    hourly(input: { from: "2022-08-05", to: "2022-08-11" }) {
      dataPoints {
        timestamp
        value
        count
      }
    }
  }
}
Example 2: query raw AC active power values for one day in 2023 in the long data format
data {
  acActivePower {
    raw(input: { from: "2023-12-17", to: "2023-12-17" }) {
      timestamps
      values
      counts
    }
  }
}
It is possible to request multiple metrics and granularities in a single query.
To request multiple metrics and granularities in a single query, simply request multiple fields at once.
Example 3: query daily and monthly AC yield values for a month in 2021 and 15 minutes DC power values for a day in 2021, each in a wide format
data {
  acYield {
    daily(input: { from: "2021-12-01", to: "2021-12-31" }) {
      dataPoints {
        timestamp
        value
        count
      }
    }
    monthly(input: { from: "2021-12-01", to: "2021-12-31" }) {
      dataPoints {
        timestamp
        value
        count
      }
    }
  }
  acActivePower {
    tenMinutes(input: { from: "2021-12-12", to: "2021-12-12" }) {
      dataPoints {
        timestamp
        value
        count
      }
    }
  }
}
Query Optimization And Performance Tips
Only ask for what you need from the Data API. This saves time and speeds up your queries. Fetching extra data can slow down your query.
Make your queries faster by parallelizing them and using asynchronous requests. For example, if you have a dashboard with three charts (raw data, daily data, monthly data), it would be faster to request the data for each chart at the same time and display the results as soon as they arrive. This speeds up the loading time for the user and makes each query less heavy.
Use the lowest granularity possible. If you want to show daily values over a month, don't first ask for raw data and then calculate the aggregates on your own. Instead, ask for the daily aggregates directly from the backend.